How is the Fairfax County Real Estate market?

Local fruit is fresh. Like the Fairfax County Real Estate stats are: local and fresh
The other day, I was chatting with a Realtor® friend of mine who lives on the West Coast, and we were talking about each of our housing markets. As expected, our markets are very different, but it’s hard to really know what’s going on in each market from what the national media reports.
Without our chat, I would have not known that her market was up significantly from last year and that it was well on its way to recover from the housing bubble of a few years back.
Real Estate is local
As they say, real estate is a very local matter, and unless we review the local statistics, it’s difficult to get the real picture. Even reading the “Washington area real estate news” is not local enough. As you know, the Washington DC area is comprised of a few counties in Maryland, a few counties in Virginia, plus Washington, D.C. – so it’s not quite local enough for getting an accurate picture.
So, when my Realtor ® friend asked me: Has the Fairfax County Real Estate Market recovered from the housing bubble of a few years back? I chose to answer her question with this article.
Let’s analyze the local stats (i.e. just the Fairfax County Real Estate market).
On this analysis, we’ll focus on the previous 5 years of activity in the Fairfax County Real Estate Market, and we’ll look at:
- Average sold prices,
- Average Days on Market, and
- Inventory vs. Closed Sales
Let’s get started:
Fairfax County Real Estate Average Sold Prices for the past 5 years
First, let’s see how the current average sold price of $474k from October 2012 compares with the preceding 5 years (use the orange line to compare):
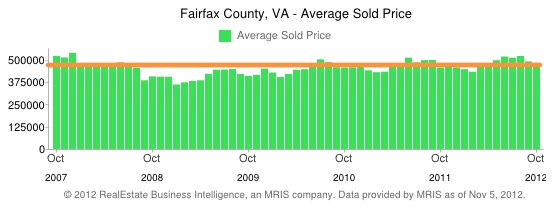
Fairfax County Real Estate Average Sold Price – 5 year history
The average sold price back in October of 2007 was above our orange line, and above the $500k mark (this was the tail end of the housing bubble).
A year later, in October of 2008, and then in October of 2009, the average sold prices were below our orange line.
From October 2010 on, it looks like the average sold price for the past three Octobers has been relatively flat (right along the orange line).
As you can see, the latest 3 years of average sold prices in October are still below the average sold price in October of 2007.
From this analysis, we can see that Fairfax County real estate prices have been relatively stable for three years in a row, after a dip following the housing bubble.
Now let’s look at how fast homes have been selling in the same period of time (in the last 5 years).
Fairfax County Real Estate average Days on Market (DOM)
To figure out how fast homes have been selling throughout the past 5 years, we use the “Days on Market” or DOM metric. (The DOM field in the Multiple Listing Service keeps a count of how many days a property listing has had a status of “Active”. So, the moment that a property goes under contract, or that it gets temporarily pulled of the market, the DOM counter stops. If the property listing comes back on the market, the DOM counter resumes the count. If the property goes to settlement or the listing gets completely pulled off the market, then the DOM counter stops counting.)
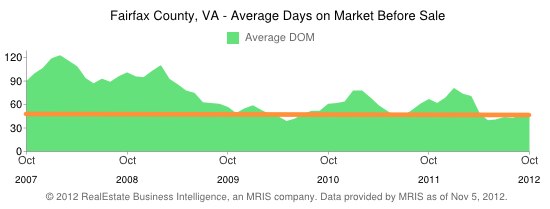
Fairfax County Real Estate average Days on Market (DOM) – 5 year history
Based on this graph, we can see that homes which went under contract in October of 2007 were active for an average of 90 days before going under contract.
Then, in October of 2009, the Days on Market dropped from 90 days to about half (45 days). And, this DOM metric has stayed fairly constant at 45 days (as measured every October) since October of 2009.
Could it be that there were fewer homes for sale starting in 2009, which is why they sold faster?
Let’s compare the available inventory and the number of closed sales:
Fairfax County Real Estate Inventory & Closed Sales
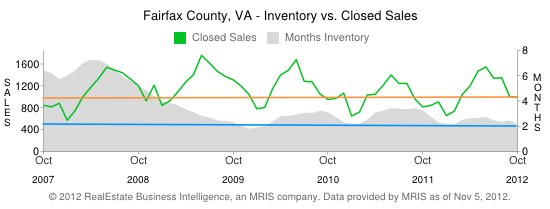
Fairfax County Real Estate Inventory & Closed Sales – 5 year history
From this graph, we can see that the inventory (the grey area) declined significantly between October 2007 – with about 6 months of inventory-, and October of 2009 -with about 2 months of inventory- (use the blue line to compare).
The inventory graph mimics the Days on Market graph that we saw before (i.e. the faster homes sell, the less inventory there is). But this discovery still doesn’t answer the question of whether there were fewer homes for sale overall or if the same amount of homes for sale was selling faster.
Are there fewer homes for sale, or are they selling faster?
The green crooked line on the graph above displays the number of closed sales per month. Back in October of 2007, there were about 800 sold homes.
In October of 2009, the number of sold homes jumped significantly to about 1300. In October of 2010, the number of sold homes was about 1000, the same as this past October of 2012.
From these numbers, we can see that the number of sold homes has been relatively stable after 2007, and that the inventory (and the DOM) have come down significantly since then. Which means that there has been a healthy amount of demand to keep up with the supply of homes.
And looking again at the Average Sold Price graph, we can see that after prices self-corrected in 2008 and 2009, the average sold price has held fairly stable since 2010:

Fairfax County Real Estate Average Sold Price – 5 year history
Does this analysis tell us how the real estate market is in Fairfax County?
Well, yes, it does answer the question. These graphs tell us that the market has been fairly stable for the past three years:
- Stable average sold price
- Demand (sales) is keeping up with the supply (inventory)
The statistics point to a healthy real estate market in Fairfax County
Next Week
Photo by kthread on flickr






 Everybody is welcome to find a home by school boundary. A school boundary
is simply a geographical area, just like a zip code or a postal city.
 Does anything on this website bug you? Nothing is too small or too big. If there is something we can fix, we'd love to know.

