Last week, I was talking to a new client, Betty. She was asking me about how we rate schools. I told her that we use the SOL passing rates to help our readers compare schools.

Students take Standards of Learning (SOL) tests
She was satisfied with the answer, but she went one step further. She asked about exactly what SOL passing rates were, and how they related to SOL scores, which she had heard of from her friends with kids in school.
So let’s start from what Standards of Learning (SOL) are:
What are Standards of Learning (SOL)?
The Virginia Standards of Learning (SOL) are standardized tests that are administered to students starting in 3rd grade and through high school. These tests cover subjects such as English, mathematics, science, and history [1].
The SOL tests are meant to measure how well the students are learning throughout the State of Virginia.
To measure how well students are learning, the schools and their corresponding districts provide each test’s result up to the Virginia Department of Education (VDOE). The VDOE compiles the results and publishes them as scores and passing rates.
What is an SOL score?
Each SOL test is made up of about 35-50 items or questions. To grade the test, a score is calculated based on each student’s number of correct answers.
This score is reflected on a scale of 0-600 and it’s called the “SOL Scaled Score”.
The minimum scaled score to “pass” the test is 400. So let’s see what a “pass rate” is:
What are SOL pass rates?
For each test, the Virginia DOE calculates how many students had a score of 400 or above and counts that test as “passed”. Then, it calculates the ratio of how many students passed the test out of the total number of students who took the test and publishes that number as a passing rate (or percentage).
SOL pass rates are used to measure achievement
For educational purposes, SOL pass rates (among other indicators) are used by each State -under federal law requirements- to evaluate whether each school and school district is meeting their accreditation standards.
SOL pass rates are also used to compare schools
Many people also use SOL pass rates to get an indication of how “good” a specific school is, mostly because it’s one of the few objective indicators that one can use to compare the academic achievement of students in different schools.
And while SOL pass rates as a comparison tool are a way to get the big picture, when you want to refine the comparison further, you can use the average SOL scores.
For example, if two schools had the same SOL pass rate of 95 (out of 100)
One could use the average SOL scores to refine the comparison:
- School A: 95 % pass rate – average score of 450, and
- School B: 95 % pass rate – average score of 500 (which is considered “advanced proficiency”).
From this comparison, one could assume that hypothetical School B is “better” than hypothetical School A – even though both schools have the same pass rate.
After this explanation, Betty asked about where she could find the average SOL scores.
Well, the information is publicly available from the VDOE, but it isn’t easy to get hold of.
Thankfully, our friends at Peer Power Inc. [2] have graciously provided us with an average of SOL test scores, by school.
The entire table is a lot of info, so we are still working through making it digestible, but here is an example for you to see what it looks like:
Here is an example of average SOL scores for the Top 3 Middle Schools
These are the Top 3 middle schools by SOL pass rates [3]. They also send the most students to Thomas Jefferson High School for Science and Technology [4]:
Average SOL Pass Rates & Scores for the Top 3 Fairfax County Middle Schools (2012-2013)
| Rank | Middle School | High School Pyramid | SOL Pass % 2012-13 | Avg SOL Scores 2012-13 |
|---|---|---|---|---|
| 1 | Rocky Run MS | Chantilly | 96 | 503 |
| 2 | Longfellow MS | McLean | 95 | 497 |
| 3 | Carson MS | Oakton | 95 | 494 |
In the next few weeks, we’ll incorporate this data onto our school boundary pages (accessible via the Fairfax County Map of High School Boundaries)
In the meantime, let us know if you are interested in comparing specific schools and we’d be happy to provide you the information.
Click for the Fairfax County Map of High School Boundaries
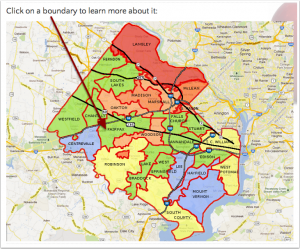
- Click to access the Fairfax County Map (with UP-TO-DATE high school boundaries)

Access the Fairfax County Map of School Boundaries (a.k.a the Affordability Map) to see the location of each of the most UP-TO-DATE boundaries within Fairfax County and to choose your ideal boundary.
When you access the Fairfax County Map of School Boundaries, you will find:
- UP-TO-DATE High School boundaries
- School scores for elementary, middle and high schools in each boundary
- Photos and videos
- Highlights of the area covered by each boundary
- Transportation options
- Statistics about housing
If you haven’t subscribed yet, why wait?

- The FREE No-Tears Guide to Moving to Fairfax, VA

Downloading The No-Tears Guide to Moving to Fairfax, VA is free, and you’ll get access to our unique home-search (by school boundary).
Plus, you get the Fairfax County Real Estate Affordability Map, AND access to detailed information about each Fairfax County School boundary.
[1] http://www.doe.virginia.gov/testing/scoring/index.shtml
[2] http://www.peerpowerinc.com/ – Find out what your SOL score means
[3] http://fairfax.homebyschool.com/fairfax-county-middle-school-rankings/
[4] http://fairfax.homebyschool.com/top-3-middle-schools-thomas-jefferson-tjhsst/
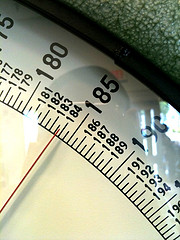
Image by Renato Ganoza on flickr


 Everybody is welcome to find a home by school boundary. A school boundary
is simply a geographical area, just like a zip code or a postal city.
Everybody is welcome to find a home by school boundary. A school boundary
is simply a geographical area, just like a zip code or a postal city.
 Does anything on this website bug you? Nothing is too small or too big. If there is something we can fix, we'd love to know.
