Kids love to compare. From when we are little, we learn to make decisions by comparing attributes. Who runs faster?, Who is older?, Who is taller?
When we grow older, we still love to compare. Which way is faster? Which grocery store is cheaper? Which school district is better?
In this post, we analyze three points of data to help you compare one school district to another.
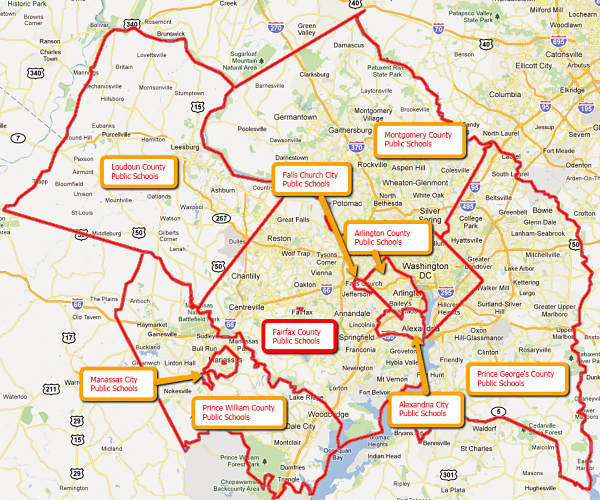
First, let’s review the different public school districts in the DC Metro Area:
There are 9 public school districts surrounding Washington D.C.
In Maryland:
- Montgomery County
- Prince George’s County
In Virginia:
- Alexandria City
- Arlington County
- Fairfax County
- Falls Church City
- Loudoun County
- Manassas City
- Prince William County
In this post, we’ll focus on Fairfax County Public Schools district and how it ranks in comparison to the other 8 districts in the Washington area.
One way to compare Fairfax County Schools to nearby districts is by size
Why use size as a point of reference? As you can see from the table below, some school districts are significantly smaller than others (some are much less than 10% of the size of the bigger ones). Bigger districts might have more resources overall, and more program choices, whereas smaller districts might be more intimate and efficient. Once you gauge the size of each district, you can make a decision about which one might be a better fit for your needs.
When we compare the Fairfax County Public Schools District to nearby ones, the enrollment numbers tell us that Fairfax is larger than all other nearby districts.
Fairfax County Public Schools ranking: #1 by enrollment
| Rank | School District | Enrollment |
|---|---|---|
| # 1 | Fairfax County | 177,629 |
| # 2 | Montgomery County | 146,709 |
| # 3 | Prince George’s County | 125,168 |
Another way to rank school districts is by their graduation rates
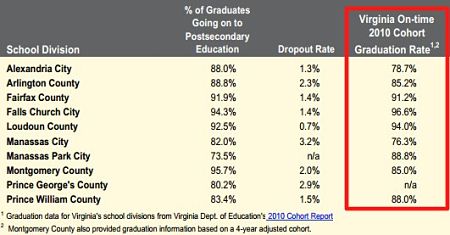
In this next table, we can see the reported numbers of the Virginia Department of Education, calculating the graduation rate per district:
The State of Virginia calculates the graduation percentage rate of high school students by counting the number of seniors graduating this “cohort” year and dividing by all the students who started high school 4 years before this graduation year, plus adding and subtracting transfers throughout the years.
Fairfax County Public Schools ranking: #3 by Graduation Rate
| Rank | School District | Graduation Rate |
|---|---|---|
| # 1 | Falls Church City | 96.6% |
| # 2 | Loudoun County | 94% |
| # 3 | Fairfax County | 91.2% |
Now we know the percentage of kids who graduated from each of these districts, but how well were these kids prepared for college?
A third way to compare school districts is using their average SAT scores
One objective way to compare how well-prepared kids are getting out of high school is by looking at their SAT scores.
Here we can see the average SAT scores per school district, and another important metric to notice is the percentage of seniors taking the test, as this would indicate how many of the overall seniors contributed to those scores.
Fairfax County Public Schools ranking: #2 by SAT scores
| Rank | School District | Average SAT Score | Seniors taking SAT |
|---|---|---|---|
| # 1 | Falls Church City | 1774 | 92% |
| # 2 | Fairfax County | 1654 | 77.7% |
| # 3 | Montgomery Co. | 1637 | 71% |
As you can see, in Fairfax County a good percentage of seniors take the SATs. The Fairfax County 2011 average SAT score of 1654 is well above the national SAT average score of 1,500, and of the Virginia SAT average score of 1,516 (the maximum total score for the SAT is 2400).
In summary, Fairfax County Public Schools ranking:
- # 1 as the largest school district in the region (by enrollment),
- # 3 by graduation rates, and
- # 2 by SAT scores (well above the National and Virginia average scores)
Next Step
To go one step further and learn about Fairfax County high school rankings, download the FREE No-Tears Guide to Moving to Fairfax VA. The first download “How to Choose the Right School” contains a table comparing high schools using 3 kinds of scores (SATs, Standards of Learning, & The Washington Post’s “Challenge Index”).
Source of data: http://www.fcps.edu/fs/budget/wabe/2012.pdf. Map data by Google. Image by emeryjl on flickr


 Everybody is welcome to find a home by school boundary. A school boundary
is simply a geographical area, just like a zip code or a postal city.
 Does anything on this website bug you? Nothing is too small or too big. If there is something we can fix, we'd love to know.

